Investors and economists alike often grapple with the intricate relationship between economic cycles and stock market cycles. Understanding how these cycles interplay can provide valuable insights for making informed investment decisions. This blog delves into the relationship between economic cycles and stock market cycles, exploring their phases, correlations, and the factors influencing their dynamics.
Understanding Economic Cycles
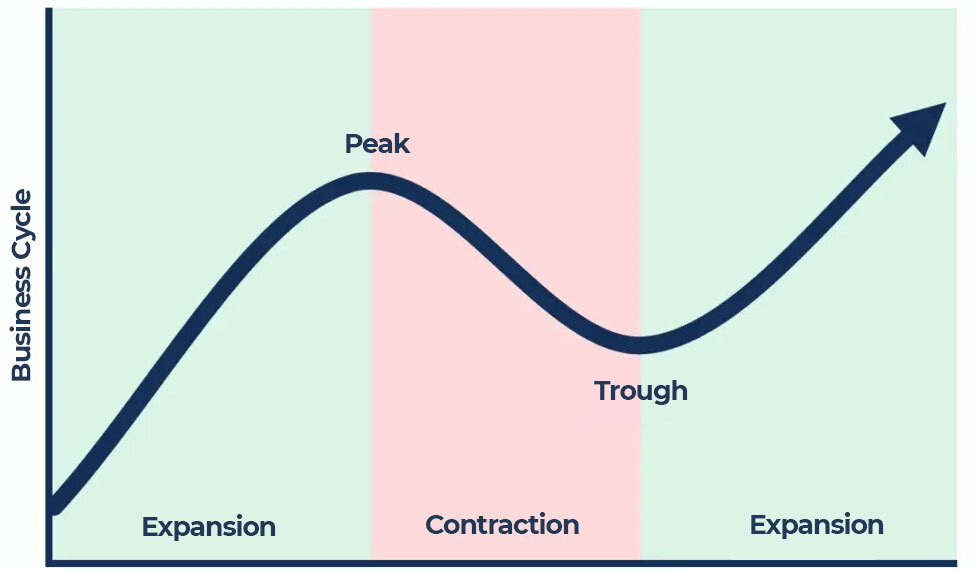
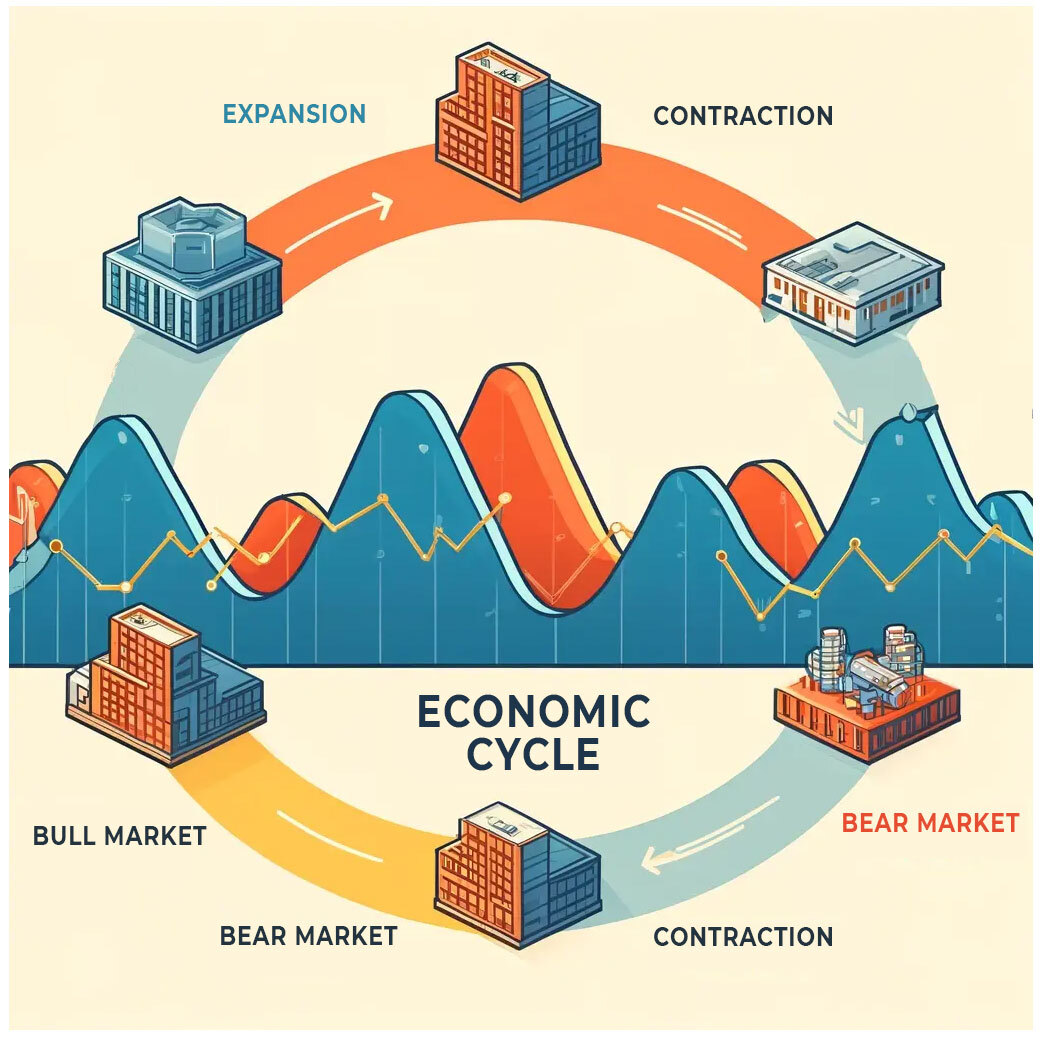
Economic cycles, also known as business cycles, refer to the fluctuations in economic activity over time. These cycles typically comprise four phases:
Expansion: Characterized by rising economic activity, increased consumer spending, higher employment rates, and robust business investments. GDP growth is strong during this phase.
Peak: The economy reaches its highest point of activity, with maximum output and employment levels. Inflation may begin to rise as demand outstrips supply.
Contraction: Also known as a recession, this phase is marked by declining economic activity, reduced consumer spending, rising unemployment, and lower business investments. GDP growth slows down or becomes negative.
Trough: The economy hits its lowest point, with minimal output and high unemployment. This phase sets the stage for a new cycle of expansion.

Understanding Stock Market Cycles
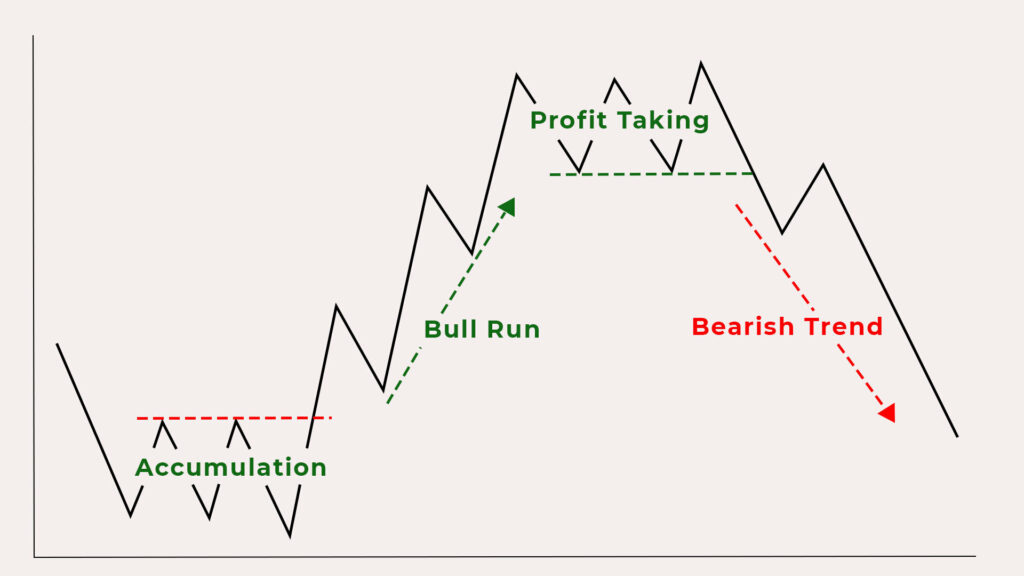
Stock market cycles reflect the fluctuations in stock prices over time, often driven by investor sentiment, corporate earnings, interest rates, and macroeconomic factors. Stock market cycles also have four primary phases:
Accumulation: Occurs after a market bottom when informed investors start buying stocks at low prices, anticipating a recovery. Market sentiment is generally bearish but improving.
Bull Run: Characterized by stock prices rising steadily and a market exhibits a general upward trend. This eventually leads to more investors gaining confidence as volume and trade activity increase.
Profit Taking: Starts during a bull run, particularly as prices reach new highs & valuations become stretched. It also occurs during the distribution phase (the highest level of profit taking)
Bearish Trend: It’s followed by a bull market’s peak. Prices are at or near their highest but volatility increases & trading volumes remain high. Bearish trend also comes in the form of a markdown phase where prices begin to decline steadily.
Reach out to our trading specialists today to learn more. Call Now: 021-111 115 272 or
Contact on WhatsApp: http://bit.ly/3vG1UOM

The Relationship Between Economic and Stock Market Cycles
The relationship between economic cycles and stock market cycles is complex and often exhibits a lead-lag effect. Here’s how they typically interact:
Stock Market as a Leading Indicator: The stock market often reacts to anticipated changes in the economy rather than current economic conditions. For instance, stock prices may start rising before an economic expansion becomes evident, reflecting investor optimism about future growth. Conversely, the market may decline ahead of an economic contraction, as investors anticipate slower growth and reduced corporate earnings.
Phases of Divergence: There are times when the stock market and the economy diverge. For example, the stock market may continue to rise even as economic growth slows down, driven by factors like low interest rates, monetary stimulus, or strong corporate earnings. Conversely, the market may fall during an economic expansion due to geopolitical risks, high valuations, or policy uncertainties.
Impact of Monetary Policy: Central banks play a crucial role in influencing both economic and stock market cycles through monetary policy. Lowering interest rates can stimulate economic activity and boost stock prices, while raising rates can have the opposite effect. Quantitative easing and other unconventional measures also impact investor sentiment and market dynamics.
Investor Sentiment, Political and Behavioural Factors: Investor psychology and behavioral biases often amplify the relationship between economic and stock market cycles. Fear and greed can lead to overreactions, causing market cycles to be more volatile than economic cycles. Herd behavior, where investors follow the actions of others, can also lead to exaggerated market movements.
Conclusion
Understanding the relationship between economic cycles and stock market cycles is crucial for investors seeking to navigate the financial markets effectively. While the stock market often acts as a leading indicator of economic activity, the interplay between these cycles is influenced by a multitude of factors, including monetary policy, investor sentiment, political scenario and external shocks. By recognizing the phases of both cycles and the factors driving their dynamics, investors can make more informed decisions and potentially capitalize on the opportunities presented by these cyclical patterns.
In summary, while economic and stock market cycles are inherently linked, they are not always perfectly synchronized. Staying informed and adopting a disciplined investment approach can help mitigate risks and enhance returns in the ever-changing landscape of economic and market cycles.

